
Muskoka waterfront real estate · Third quarter 2026
Outside the three biggest lakes, Muskoka waterfront sales slipped 13 per cent while the median price barely moved
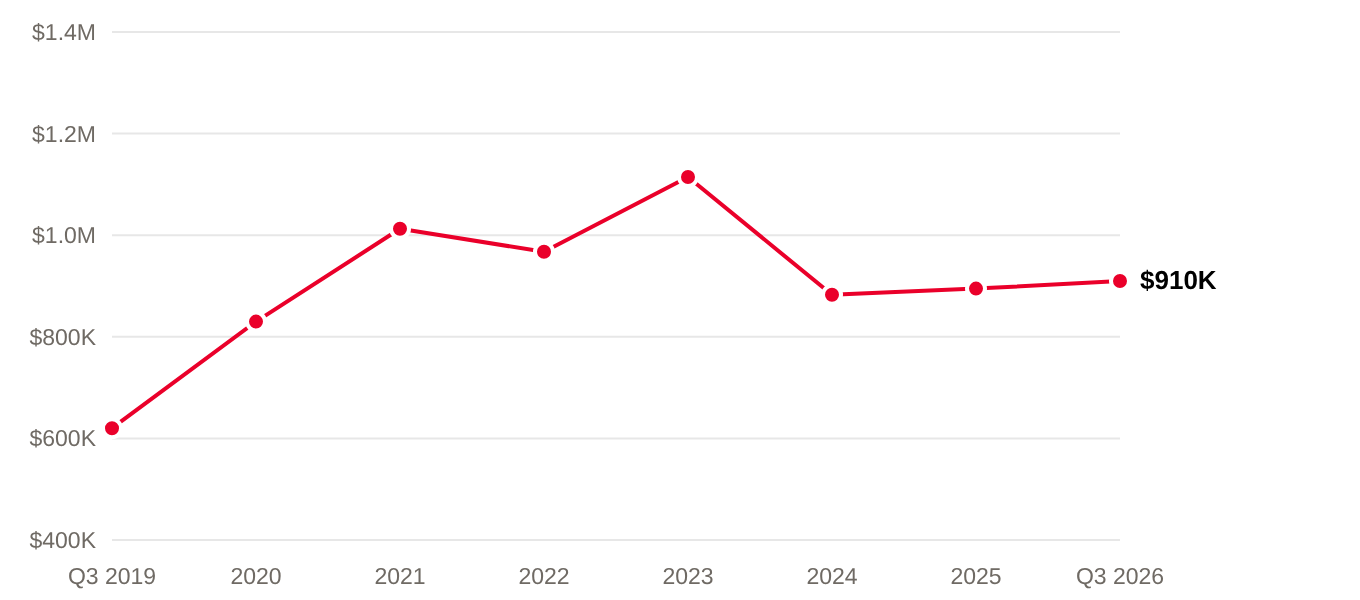
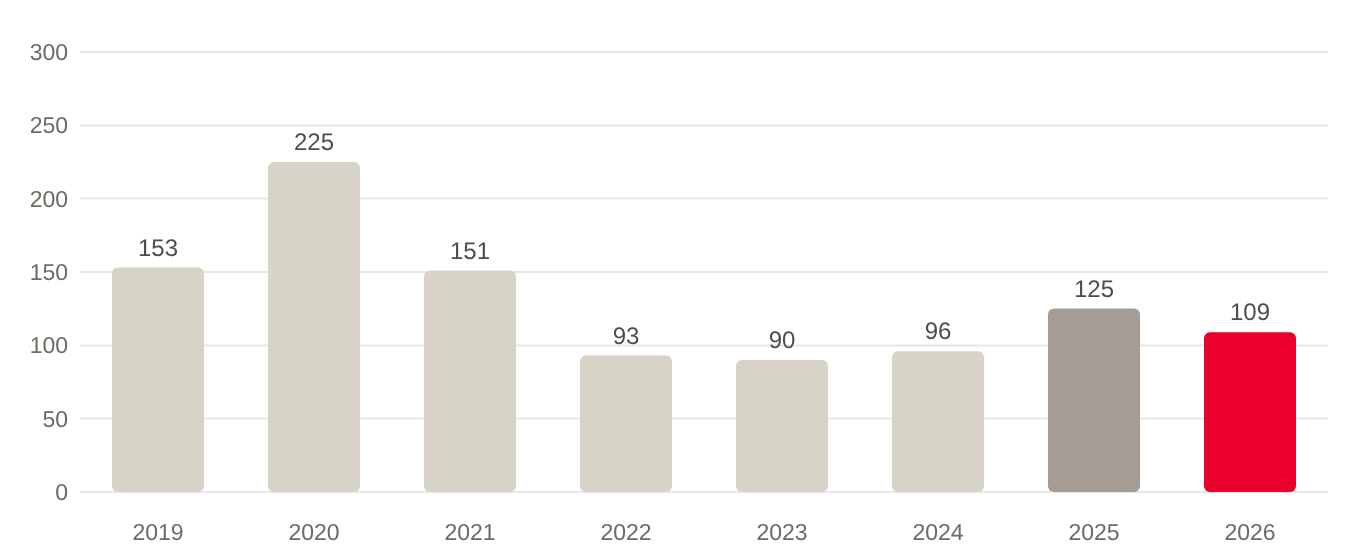
Without Lakes Rosseau, Muskoka and Joseph, 109 waterfront homes sold from July to September, compared with 125 a year earlier. The median price was $910,000, 1.7 per cent above last year, and the average rose 11 per cent.
For the first nine months of the year, waterfront sales are down 10 per cent (234 to 210).
| Q3 2025 | Q3 2026 | Change | |
|---|---|---|---|
| Sales | 125 | 109 | −12.8% |
| Median sale price | $895,000 | $910,000 | +1.7% |
| Average sale price | $1,106,804 | $1,226,603 | +10.8% |
| Lower quartile price | $625,000 | $658,000 | +5.3% |
| Upper quartile price | $1,340,000 | $1,450,000 | +8.2% |
| Sold over list price | 9.7% | 12.8% | +3.2 % |
| Average sale-to-list ratio | 94.5% | 94.9% | +0.4 % |
| Median days to sell | 35 | 38 | +3 days |
Prices
Median waterfront sale price, third quarter, 2019 to 2026
Source: OnePoint Association of Realtors.
Median prices have remained stable over ther past several 3rd quarters buoyed in large part by larger priced sales in that period over the past 3 years. The median is 18 per cent below its third-quarter high of $1,114,500 in 2023.
Price ranges
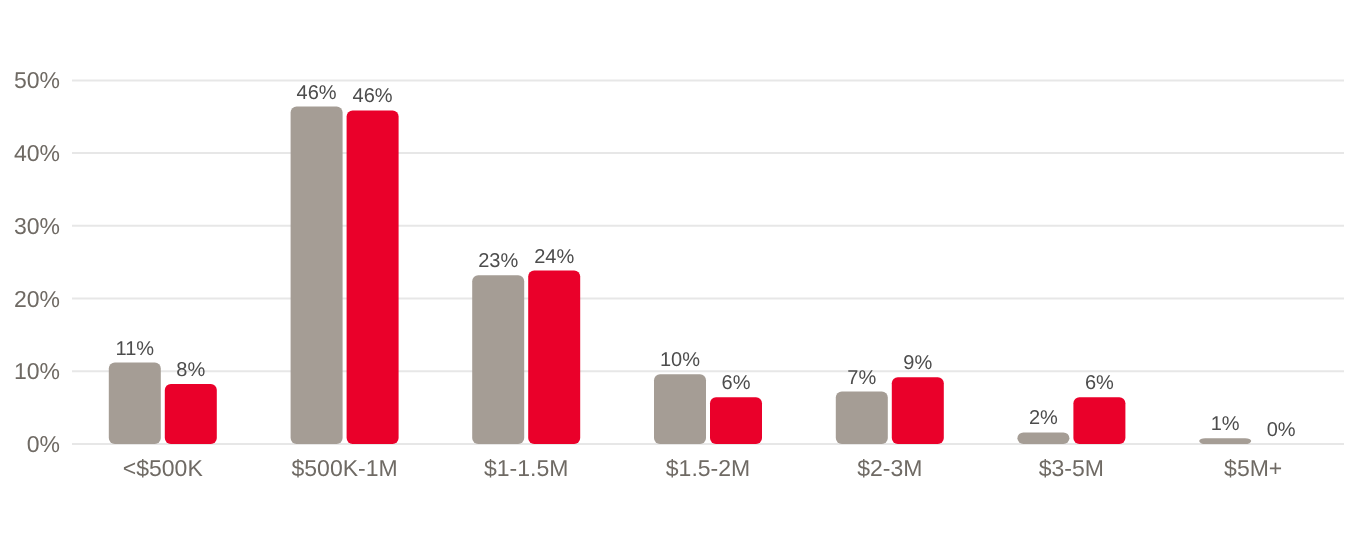
The biggest gain in share was in sales of $3M to $5M (2 per cent of waterfront sales in 2025 now 6 per cent in 2026). The biggest drop was in sales between $1.5M to $2M (10 per cent to 6 per cent).
Waterfront sales by price band
Grey is Q3 2025, red is Q3 2026.
Source: OnePoint Association of Realtors.
| Price band | Sales 2025 | Share 2025 | Sales 2026 | Share 2026 | Share change (pts) |
|---|---|---|---|---|---|
| Under $500K | 14 | 11.2% | 9 | 8.3% | −2.9 |
| $500K to $1M | 58 | 46.4% | 50 | 45.9% | −0.5 |
| $1M to $1.5M | 29 | 23.2% | 26 | 23.9% | +0.7 |
| $1.5M to $2M | 12 | 9.6% | 7 | 6.4% | −3.2 |
| $2M to $3M | 9 | 7.2% | 10 | 9.2% | +2.0 |
| $3M to $5M | 2 | 1.6% | 7 | 6.4% | +4.8 |
| $5M and up | 1 | 0.8% | 0 | 0.0% | −0.8 |
| All sales | 125 | 100% | 109 | 100% |
Sales Activity
Waterfront single-family sales in the third quarter, 2019 to 2026
Source: OnePoint Association of Realtors.
| Month | 2025 | 2026 | Change |
|---|---|---|---|
| July | 40 | 30 | −25% |
| August | 43 | 36 | −16% |
| September | 42 | 43 | +2% |
Asking prices
These figures use each home's last list price. Many properties were first listed at a higher price and had one or more price reductions or relists before they sold. These figures are measured against their latest asking price, so the gap between the first asking price and the final sale price is larger than shown here.
Share of sales that sold over list price
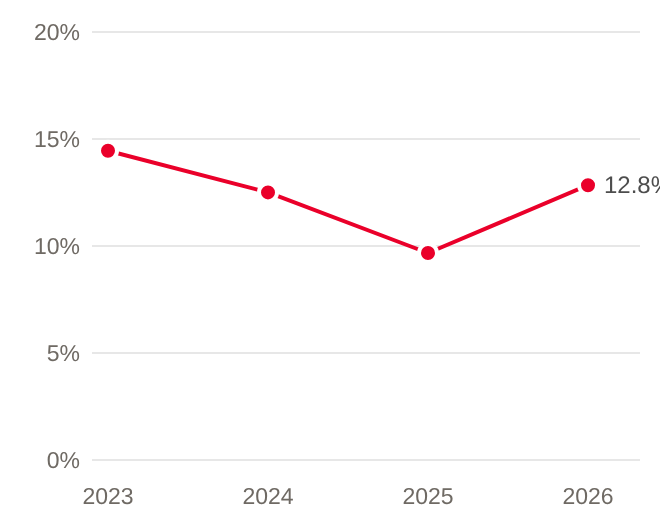
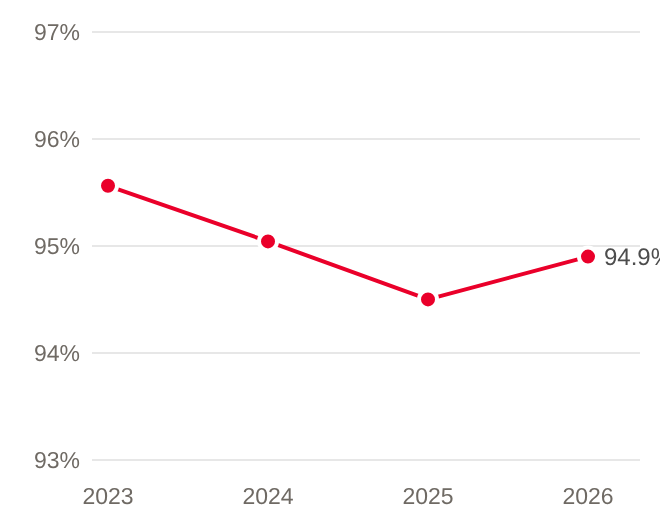
Average sale price as a share of list price
The axis starts at 93%.
Source: OnePoint Association of Realtors.
| Quarter | Sold over list | Average sale-to-list ratio | Sold 10%+ under list |
|---|---|---|---|
| Q3 2023 | 14.4% | 95.6% | 12.2% |
| Q3 2024 | 12.5% | 95.0% | 19.8% |
| Q3 2025 | 9.7% | 94.5% | 11.3% |
| Q3 2026 | 12.8% | 94.9% | 12.8% |
Inventory and market balance
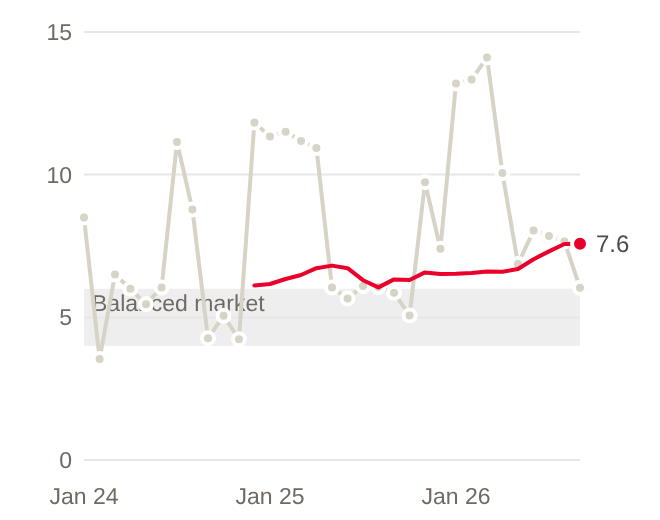
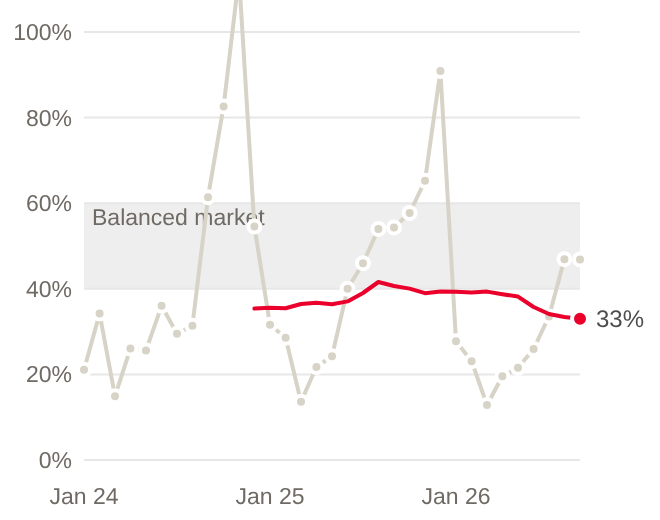
Months of inventory and sales to new listings show whether the market favours buyers or sellers. Both a larger supply of waterfront properties and fewer sales contributed to the rise in months of inventory.
Months of inventory
Grey is each month. Red is the average of the past 12 months. Shading marks 4 to 6 months - balanced market range.
Sales to new listings
Grey is each month. Red is the average of the past 12 months. Shading marks 40% to 60%.
Source: OnePoint Association of Realtors, Historical Stats report, waterfront single-family homes in Bracebridge, Gravenhurst, Huntsville, Lake of Bays and Muskoka Lakes, January 2024 to September 2026.
Active listings by month
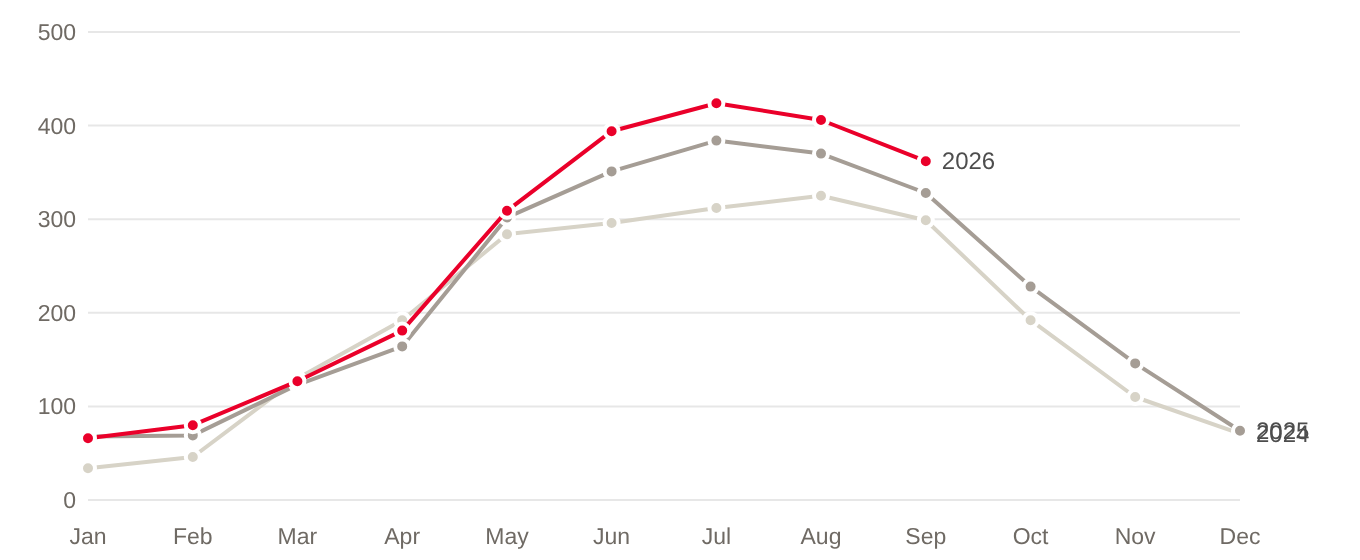
Source: OnePoint Association of Realtors, Historical Stats report, waterfront single-family homes in Bracebridge, Gravenhurst, Huntsville, Lake of Bays and Muskoka Lakes, January 2024 to September 2026.
Terminations are listings that ended without a sale. Some are relisted, so the count overstates the number of homes that ultimately left the market but it a higher number still reflects a growing trend of properties not realizing good traction in the market.
| Third quarter (July to September) | 2024 | 2025 | 2026 |
|---|---|---|---|
| Sales | 135 | 180 | 167 |
| New listings | 327 | 353 | 402 |
| Active listings, end of September | 299 | 328 | 362 |
| Months of inventory | 6.9 | 6.0 | 7.1 |
| Sales to new listings | 41% | 51% | 42% |
| Terminations | 26 | 107 | 156 |
| Terminations as share of new listings | 8% | 30% | 39% |
| Average of past 12 months to September: months of inventory | n/a | 6.3 | 7.6 |
| Average of past 12 months to September: sales to new listings | n/a | 41% | 33% |
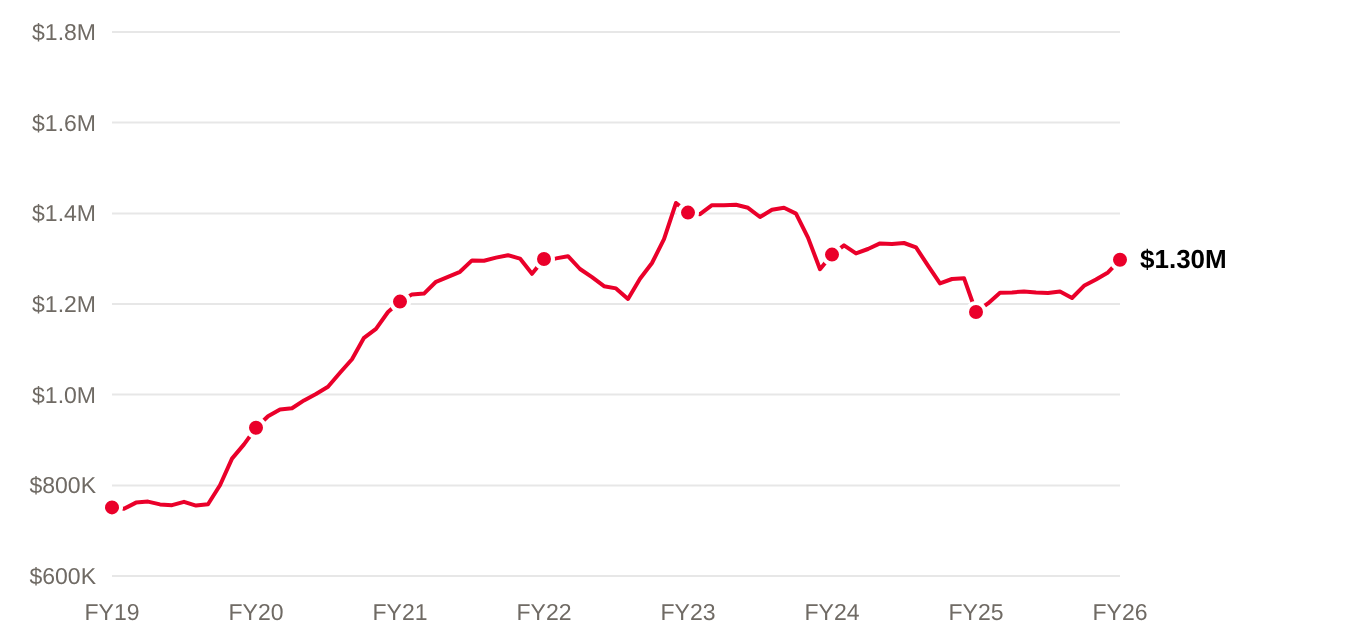
Fiscal-year view: prices over a rolling 12 months
A rolling 12-month window covers every season, so it gives a steadier read than a single quarter. Each point averages all waterfront sales in the 12 months to that month.
Rolling 12-month average waterfront sale price
Dots mark fiscal year ends.
Source: OnePoint Association of Realtors.
In August 2026 dollars. Dots mark fiscal year end.
| Fiscal year (Oct to Sep) | Sales | Median price | Average price |
|---|---|---|---|
| FY2019 | 339 | $600K | $751K |
| FY2020 | 470 | $754K | $927K |
| FY2021 | 501 | $950K | $1.21M |
| FY2022 | 309 | $1.07M | $1.30M |
| FY2023 | 267 | $1.10M | $1.40M |
| FY2024 | 267 | $1.00M | $1.31M |
| FY2025 | 285 | $970K | $1.18M |
| FY2026 | 264 | $1.00M | $1.30M |
| Change, FY2026 vs FY2025 | −7.4% | +3.3% | +9.7% |
Definitions
- Residential. Single-family homes that are not on the water (non-waterfront).
- Waterfront. Single-family homes on the water.
- Third quarter (Q3). Sales dated July 1 to September 30.
- Median. The middle sale price: half of the homes sold for less and half for more. Lower quartile and upper quartile are the prices below which one quarter and three quarters of homes sold.
- Over list price. A sale that closed above the list price. Sale-to-list ratio is the sale price divided by the list price.
- Days to sell. Days between the list date and the sale date.
- Months of inventory. Active listings divided by the month's sales, or how many months it would take to sell current listings at the current pace of sales.
- Sales to new listings. Sales divided by new listings in the same period. A lower figure means more homes are coming to market than are selling.
- Terminations. Listings that ended without a sale. Some are relisted later.
Notes on the data
- What is counted. Condominiums, townhomes, vacant land, mobile homes and fractional ownership are excluded.
- Source. All sales and listing data are from the OnePoint Association of Realtors.
- Fiscal year. Fiscal years run from October 1 to September 30 and are named for the year in which they end, so fiscal 2026 is October 1, 2025 to September 30, 2026. Rolling figures use all sales in the 12 months ending each month, by sale date.
- List price. The list price in the database is the last list price. It is not the original asking price, and it does not reflect earlier price reductions or relists. Sales with sale-to-list ratios outside 50% to 150% were dropped from the over-list and sale-to-list figures only.
- Area. Only sales labelled Bracebridge, Gravenhurst, Huntsville, Lake of Bays and Muskoka Lakes in the data are included.
- Lakes left out. Sales whose waterfront name is Rosseau, Muskoka, Joseph or Little Lake Joseph are excluded from every figure on this view, in all years. Rivers such as the Muskoka River are not excluded.
- Inventory data. Active listings, new listings, terminations and the sales used for inventory figures come from the OnePoint Association of Realtors Historical Stats report for waterfront single-family homes in Bracebridge, Gravenhurst, Huntsville, Lake of Bays and Muskoka Lakes, January 2024 to September 2026.
Enjoy this blog post? Click here to subscribe for updates
Leave A Comment