
First, the good news: sales in the first half of 2026 were virtually on par with the same period in 2025. The bad news: the 552 total sales represented the second lowest level in 25 years. Total sales, which includes all homes, cottages, condos and vacant land in the region, provides a high-level view of overall activity, but generally doesn’t provide more instructive information for, say, a submarket like in-town residential homes. But, in this case, this trend is applicable to most property types and areas.
Waterfront
The waterfront market got off to a rough start. An extended winter and regional flooding hampered early sales and the market has been sputtering a bit since then. Sales in the Muskoka region fell from 150 in the first half of 2025 to 132 in the first six months of this year. This also marked the second lowest sales activity in the last 25 years and well off the 10-year average of 335 sales for this period. It also marks the first time in 25 years that we’ve observed 5 consecutive years of declining sales.
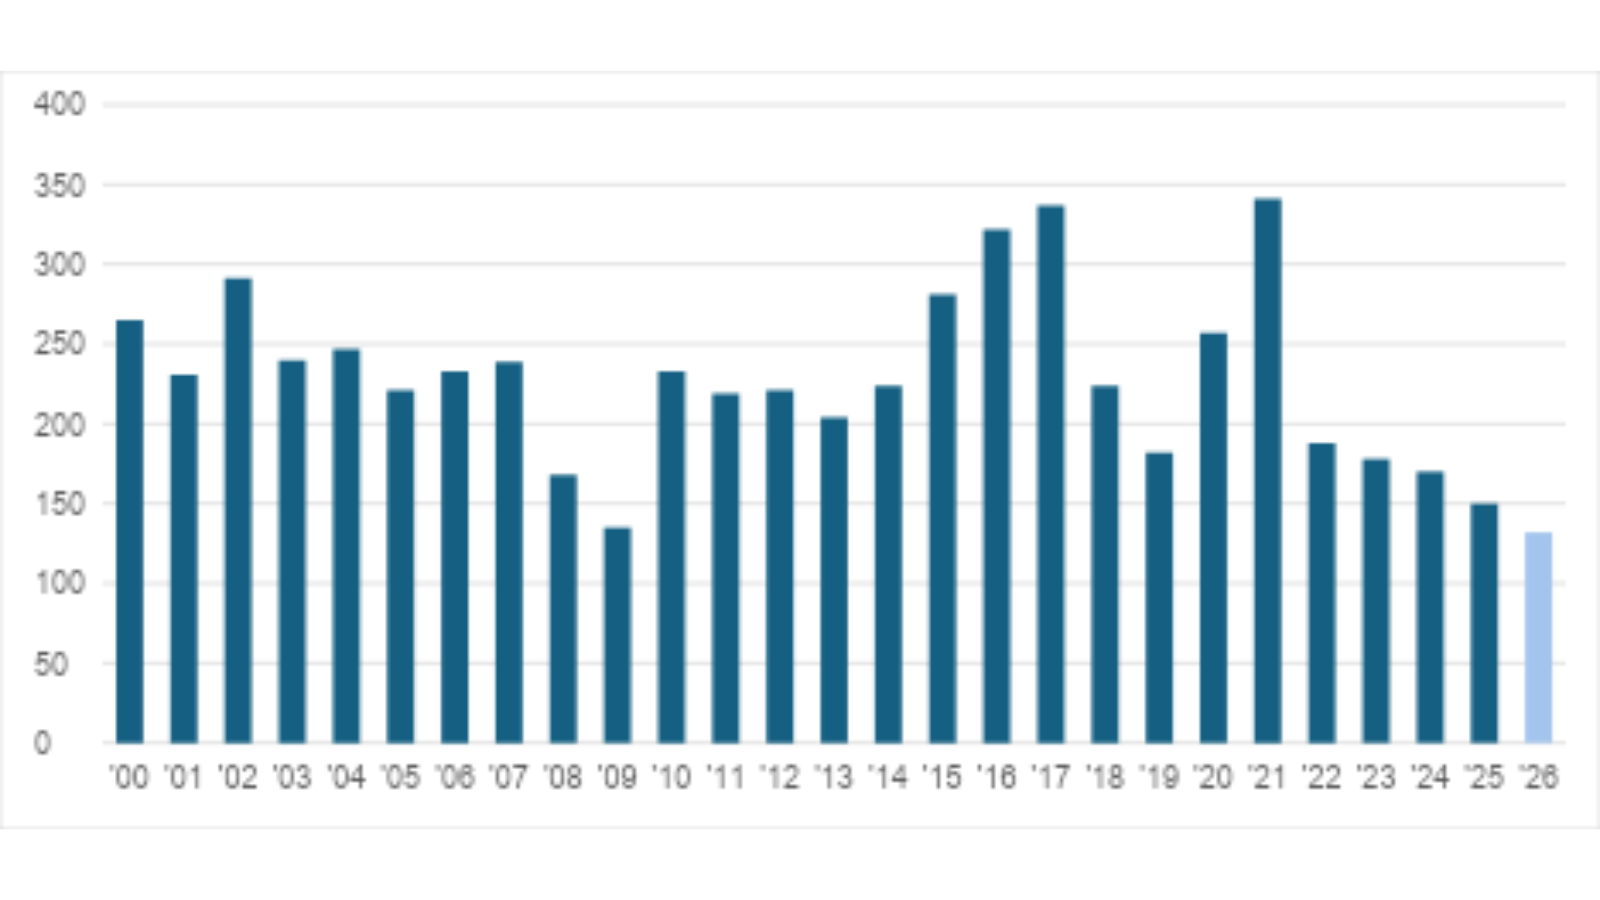
Figure 1: Muskoka Waterfront Sales, First 6 Months
Pricing
When activity drops, as it has in the Muskoka Waterfront Market, it’s rarely proportional across all price ranges. The reported average price has been volatile rather than trending down, staying elevated even as sales fall, largely due to higher relative activity in the higher price ranges. Waterfront unit sales are already a thin dataset, so when sales drop to near-record lows, a handful of unusually large transactions can swing the average meaningfully. Median is the more appropriate metric here.
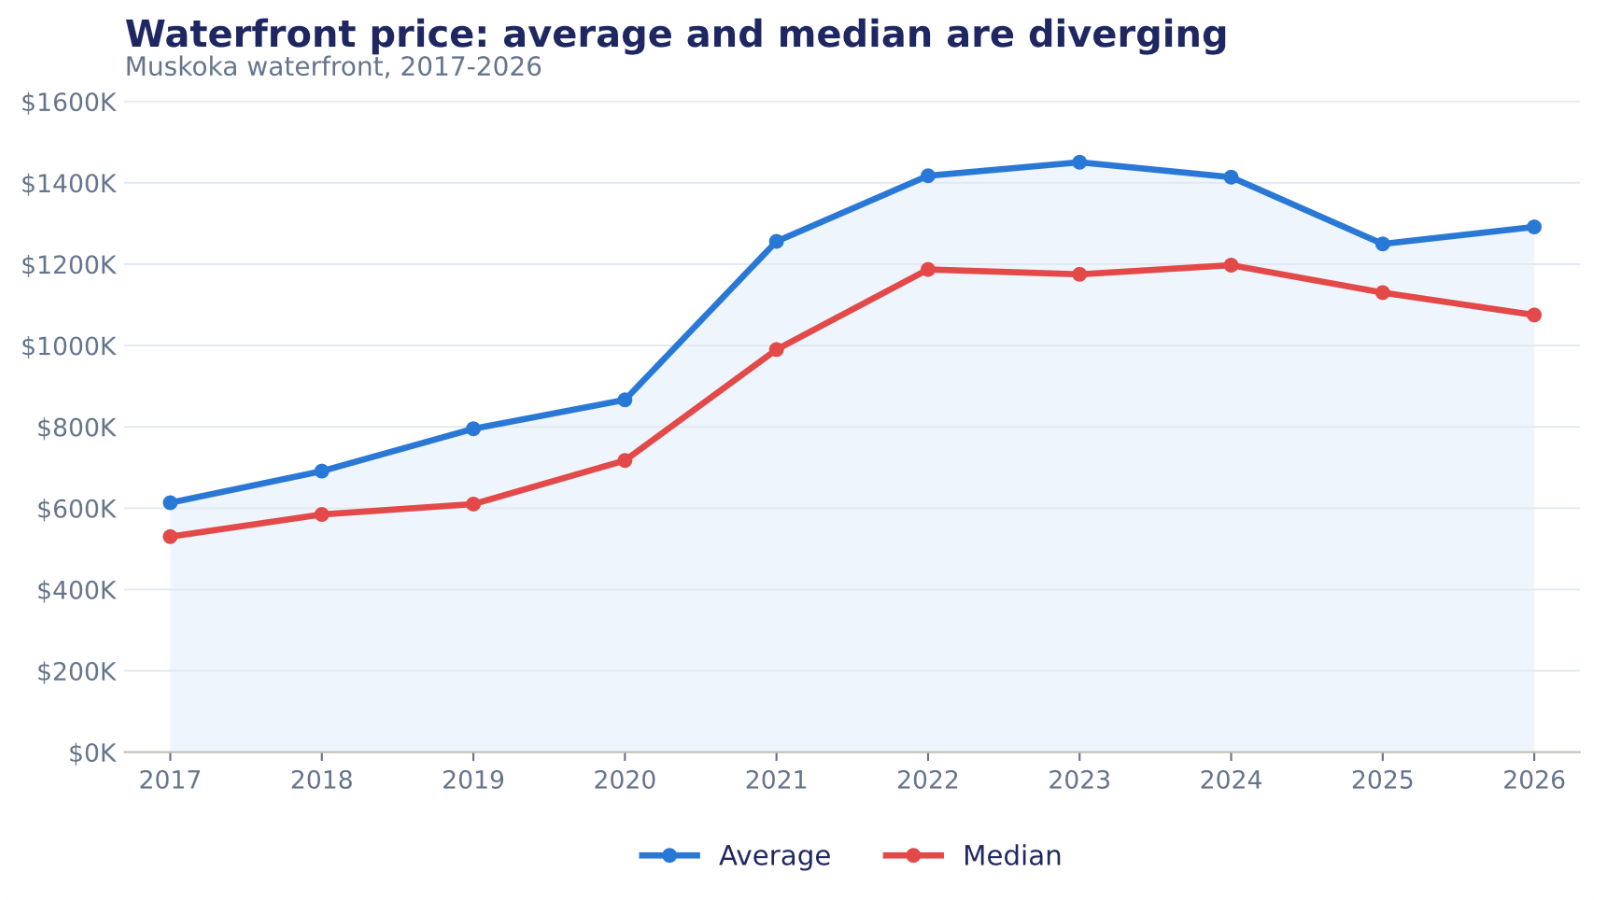
Figure 2: Median Waterfront Prices, First 6 Months of Year (does not include Lakes Joseph, Rosseau or Muskoka)
Median price for the first 6 months of the year edged lower to $1,075,000. In contrast, the average price actually increased from $1,249,721 in 2025 to $1,291,536 in 2026.
Inventory
As of the end of June, there were 388 active waterfront listings. With 48 sales in the month, months of inventory rose to just under 8.
Residential
The residential segment has remained marginally more buoyant than the waterfront market. While still below historical norms, sales increased in the first half of 2026: 311 homes sold, compared to 292 in 2025. The 10-year average for that period is 372. The price mix saw a surge in sales below $500K, with 79 sales, a 72% increase in that price category from 2025.
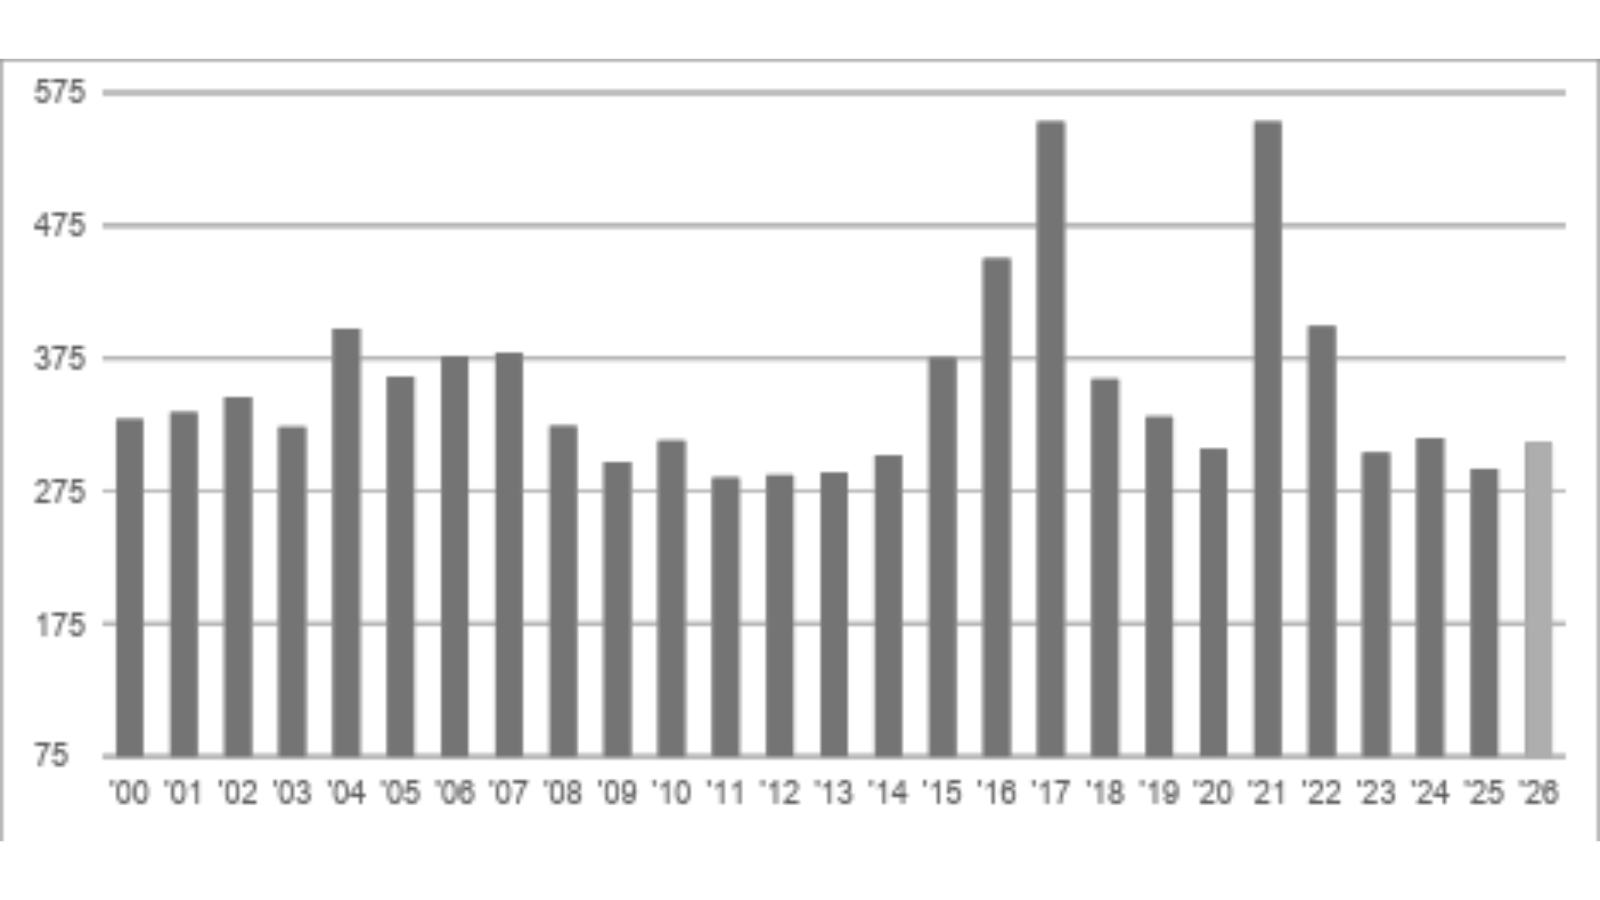
Figure 3: Residential Unit Sales
Pricing
The residential market differs from waterfront in a few key ways.
First, residential sellers are generally more need-driven. People in this market often sell because of life events such as job relocation or downsizing.
Second, comparable supply is generally deeper. A three-bedroom bungalow in Bracebridge is genuinely comparable to another three-bedroom bungalow in Bracebridge in a way that no two waterfront properties really are. Waterfront prices hold up in a slow market because scarce, largely irreplaceable properties give sellers some leverage to wait out weak demand, while residential prices track activity because abundant, substitutable inventory gives buyers choice and forces sellers to price to the market.
Third, residential buyers, especially move-up or first-time buyers, are financing a much larger share of the purchase price relative to their income than the typical waterfront buyer. Mortgage rate and stress-test math directly cap what they can offer. When borrowing costs rise or stay elevated, the ceiling on residential offers compresses in a way it doesn't for a cash-heavy or equity-heavy waterfront buyer.
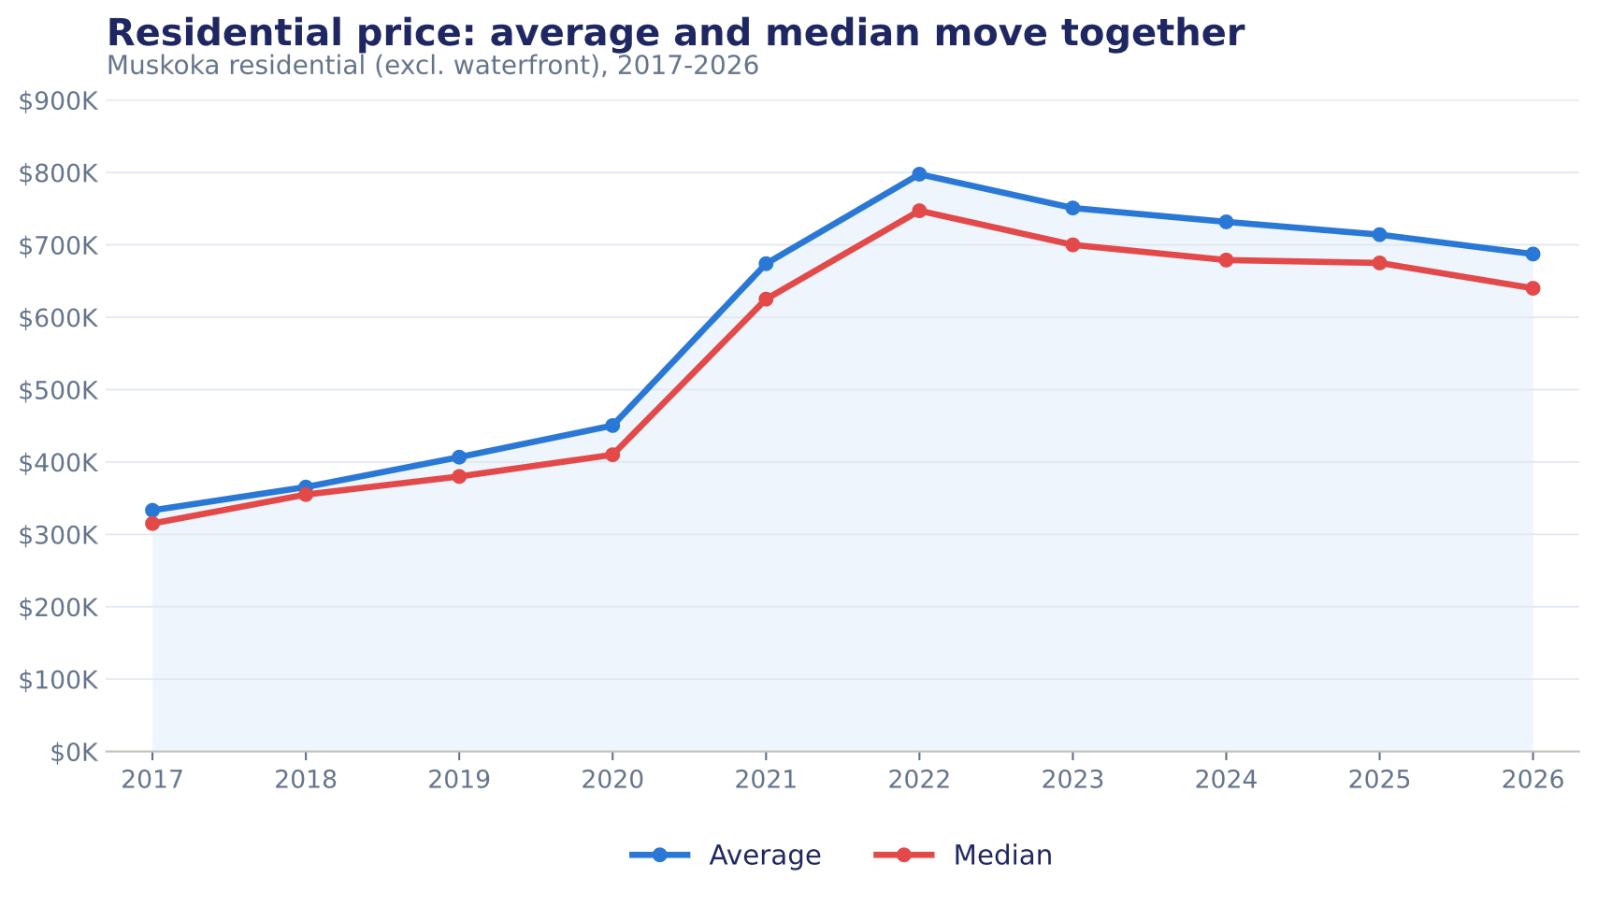
2026 marked the fourth consecutive year of declining, albeit moderately, prices since the peak of 2022. Both median and average have moved in lockstep, illustrating a broad-based price movement across the market.
Inventory
As of June 30, residential inventory sat at 350 homes with 5 months of inventory.
Enjoy this blog post? Click here to subscribe for updates
Leave A Comment